Advanced Liquid Package Solution
Any question?
Get in touch


To balance a water filling line, compare every machine on the same bottle-and-pack basis, identify the limiting operation, and give surrounding equipment enough usable capacity to recover from short stops. Then coordinate conveyors and controls so that extra capacity is used when needed, rather than continuously pushing bottles into a queue.
Equal brochure speeds are not enough. A labeler may accept the filler output during an uninterrupted run yet struggle after a reel change. A packer may look fast in packs per minute but fall short on a smaller pack format. Line balancing addresses these interactions, not just the fastest rate of each machine.
Define the reference SKU: bottle volume and geometry, cap, label format, bottles per pack, product condition and agreed output point. Ask for the normal operating range and permitted recovery rate for that exact configuration. Use the broader water filling machine guide for equipment background; the comparison here is about connected performance.
Convert different units before comparing offers:
Bottle-equivalent BPH = packs/min × bottles/pack × 60
The following is a hypothetical screening example for 500 ml still-water bottles in 12-bottle packs. These are assumed qualified running capabilities, not Alps Machine specifications or predicted shift output.
Machine | Assumed capability | Bottle-equivalent BPH | Initial interpretation |
Blow molder | 220 bottles/min | 13,200 | Above the proposed pace |
Rinser-filler-capper | 200 bottles/min | 12,000 | Proposed reference pace |
Labeler | 230 bottles/min | 13,800 | Possible recovery capacity |
Packer | 18 packs/min; 12/pack | 12,960 | Only 960 BPH above inflow |
If that packer's qualified speed were still 18 packs/min for six-bottle packs, its equivalent capacity would be only 6,480 BPH. Confirm the actual speed for each pack pattern; do not assume the pack-cycle rate stays unchanged.
These running rates do not account for accumulated downtime or rejects. To calculate real water filling line capacity , use the separate capacity guide. Keep the balancing model focused on machine interactions.
For a separate blow molder, assess usable bottle delivery at the filler entrance, not merely bottles leaving the mold. Include preform feeding interruptions, rejected bottles, transfer losses and restart behavior. Confirm that any proposed faster recovery rate still produces acceptable bottles under the actual preform, mold and utility conditions.
An empty-bottle buffer can support the filler during a short supply interruption only if sufficient bottles are already available. The blower then needs spare delivery capacity to rebuild that reserve while the filler continues consuming bottles.
An integrated blowing-filling-capping block has a different coupling arrangement from separate machines joined by an air conveyor. Do not assume independent speed settings or an intermediate buffer inside the block. The combiblock vs water filling line comparison explains that equipment-scope distinction; use the supplier's actual architecture in the balance study.

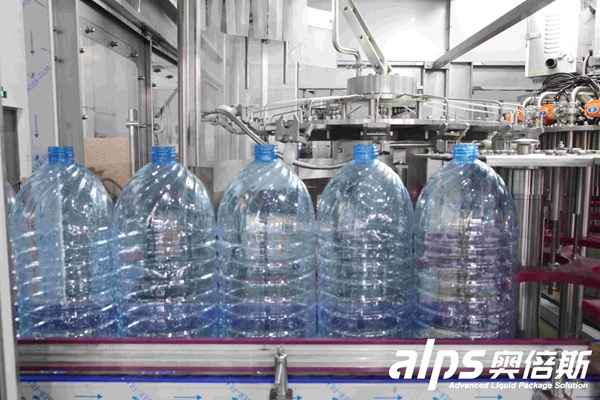
PET bottles at a machine infeed. Delivery consistency and transfer conditions matter alongside the upstream machine's stated output.
For a rinsing-filling-capping monoblock, the sections transfer bottles in synchronism. Do not assign the capper an arbitrary percentage below filler throughput: every bottle needs a closure, and an internal transfer starwheel is not a storage buffer. Cap sorting, delivery and replenishment must support the block's agreed rate.
The filler is often the selected reference machine, but identify the real constraint for each SKU. Stable water supply, bottle handling, closure delivery or a downstream operation may limit the line before the filler reaches its own ceiling. Increasing filler speed while one of these conditions remains unresolved can simply increase stop frequency.

Capping heads and transfer starwheels inside a monoblock. These synchronized handoffs are different from accumulation between independent machines.
Specify both steady-state operation and recovery operation. Check label application, coding, sleeve shrinking where applicable, pack collation, sealing, shrink-tunnel performance and downstream discharge at the proposed recovery rate. A mechanically achievable speed is unusable if label position or pack integrity deteriorates.
The Sidel-hosted white paper on line regulation and accumulation describes a V-curve approach: machines around a critical machine have additional speed capability to restore upstream supply or clear downstream accumulation after interruptions. This is a capacity relationship, not an instruction to run every conveyor faster all the time.
Choose recovery margins from the stop pattern and permitted handling speeds. A universal rule such as 'make every downstream machine 10% faster' cannot establish whether a particular line will recover before the next interruption.
Inspection and rejection equipment must also handle the recovery speed and bottle spacing. Coordinate the interface with inline inspection systems for bottled water lines ; inspection technology and defect checks are covered in that article.
Distinguish buffer capacity from the space available at the start of a stop. A downstream interruption requires empty accumulation space; an upstream interruption requires stored bottles that can reach the consuming machine. Conveyor length alone does not establish either quantity.
Extra bottles accumulated = (upstream rate − downstream rate) × interruption time
Use bottles/min and minutes consistently. In the hypothetical example, the filler continues at 200 bottles/min while the packer stops for 90 seconds. Assuming the labeler and transfers keep flowing, 200 × 1.5 = 300 additional bottles need storage upstream of the packer. Existing inventory still occupies space, so the buffer must have at least 300 free positions before the stop, with allowance for actual control and ramp behavior.
At restart, the example packer handles 18 × 12 = 216 bottles/min. Against an incoming 200 bottles/min, it removes the backlog at only 16 bottles/min:
Ideal recovery time = 300 ÷ (216 − 200) = 18.75 minutes
This assumes constant rates, no further stops and no handling losses. If recovery were qualified at 20 packs/min, the net clearance would be 240 − 200 = 40 bottles/min, reducing ideal recovery to 7.5 minutes. The question is whether the packer and every relevant downstream interface can sustain that rate with acceptable packs.
If the packer restarts at the same rate as the incoming flow, the backlog remains. If stops recur before the reserve is restored, accumulation can eventually fill despite successful individual restarts. More conveyor cannot cure a persistent capacity deficit; reduce the interruption burden, improve the limiting operation or reassess the agreed line pace.
Document the meaning of ready, running, starved, blocked and fault indications at every interface. Agree sensor locations, queue thresholds, permitted speed ranges and controlled stop/restart responses. A starved machine lacks incoming supply; a blocked machine cannot discharge. Neither condition alone proves that the affected machine caused the loss.
Compare time-stamped machine events with buffer occupancy. If the packer stops first, the labeler later blocks and the filler finally stops, address the packer event and recovery path before changing the filler. Also look for transfers or sensors that cause repeated stop-start cycling despite adequate machine capacity.
The OMAC Packaging Workgroup's PackML overview describes consistent machine data and defined behavior as aids to integration. Where PackML is used, agree the implementation and signal mapping; its presence does not by itself supply the line's buffering or restart strategy.

Drive and control hardware in a filling-machine cabinet. The photo does not establish the installed communication protocol or line-control logic.
For the balance review, have the supplier demonstrate agreed, controlled interruption scenarios: an upstream supply gap, a downstream short stop and recovery from the resulting inventory change. Compare the event record with the predicted buffer use and recovery time. Detailed FAT/SAT acceptance procedures remain a separate deliverable.
Request a SKU-specific speed matrix, usable buffer counts at normal operating levels, a control-response description and named responsibility for each interface. Sidel's line-integration overview likewise identifies critical-machine selection, availability, accumulation and controls as linked design inputs, with V-graphs and overspeeds among the engineering deliverables.
Their normal average flows must be compatible, but independent machines may need different recovery capabilities. Synchronized sections inside a monoblock must follow the supplier's coordinated control design, rather than independent percentage settings.
There is no universal duration. Base it on the interruption to be absorbed, inventory already present, bottle handling limits and recovery capacity; then check repeated events, not only one isolated stop.
No. It helps only if labeling or its recovery behavior is limiting the system and the following machines can accept the flow. Otherwise, the added speed may simply shift the queue toward packing.
A useful water filling line balance states how each SKU runs, what happens during an interruption and how normal buffer levels are restored. Share your bottle and pack formats, machine speed data and typical stop records with Alps Machine to discuss a coordinated configuration before selecting a faster standalone machine.


By continuing to use the site you agree to our privacy policy Terms and Conditions.