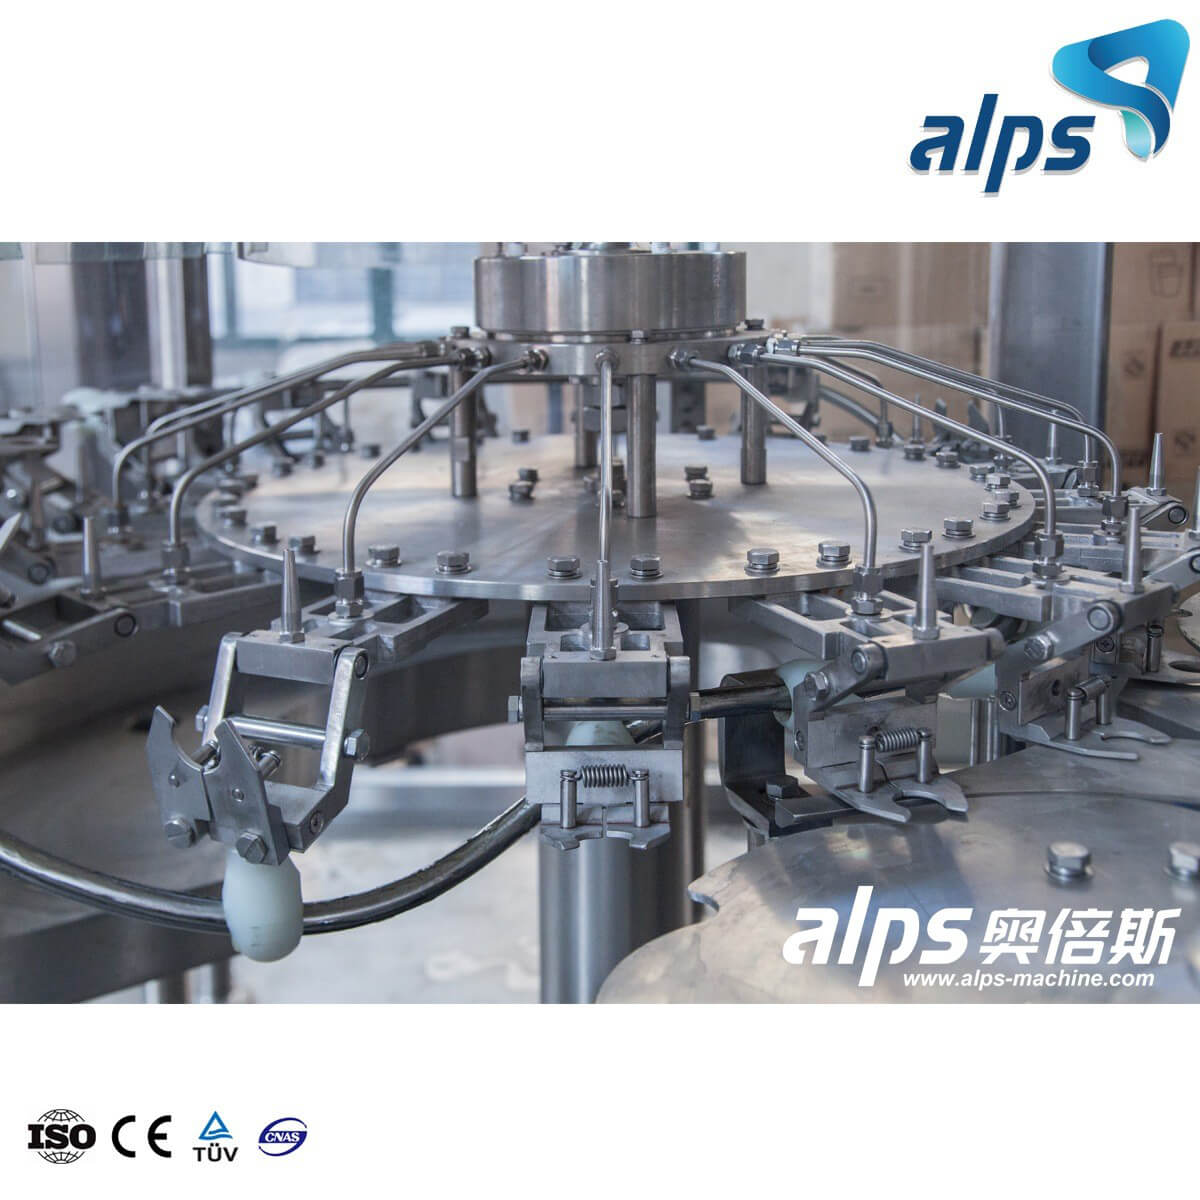
A water filling line advertised at 12,000 BPH will not automatically deliver 120,000 sellable bottles in every 10-hour production window. That result assumes continuous operation at the declared reference speed, with no changeovers, short stops, reduced-speed running, or rejected bottles.
For investment and production planning, the useful question is not simply, "What is the machine speed?" It is, "How many good bottles can the complete line deliver during the available production time?" The answer requires a declared capacity basis, a consistent time definition, and realistic loss assumptions.
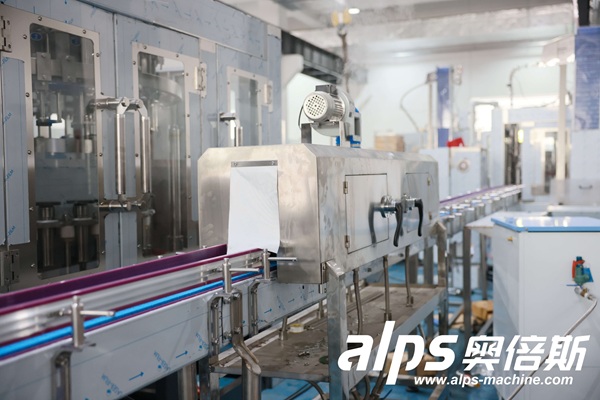
What Water Filling Line Capacity Actually Means
Capacity should be stated as a metric plus its operating conditions. A single BPH number is incomplete unless the supplier also identifies the bottle format, product, line scope, output measurement point, and test conditions.
Capacity term | Meaning | Best use |
Rated BPH | Declared speed under specified reference conditions | Comparing technically equivalent offers |
Running-rate BPH | Output while the line is actually running | Diagnosing speed loss; excludes stopped time |
Actual good-bottle BPH | Sellable bottles divided by the agreed production window | Shift performance and staffing plans |
Daily sellable output | Good bottles produced per working day | Sales, warehouse, material, and dispatch planning |
For a broader explanation of the equipment around the filler, review this complete water filling machine guide. For capacity calculations, however, keep the measurement boundary fixed: filler discharge, packer discharge, or pallet-ready product are not interchangeable output points.
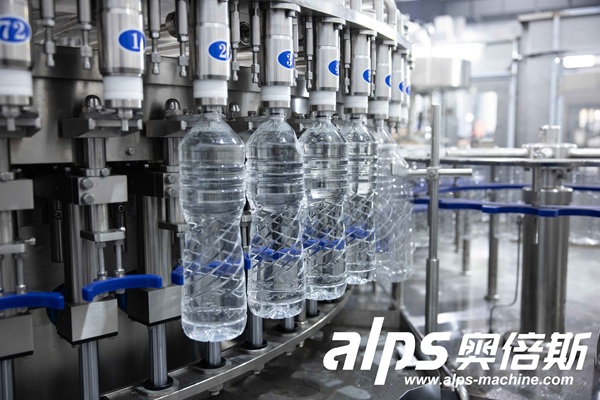
Define the Capacity Basis Before Calculating BPH
Record the following conditions beside every capacity figure:
Bottle format: volume, material, dimensions, neck finish, cap, and bottle stability.
Product condition: still water or carbonated water, filling temperature, and any process condition that changes filling time.
Line scope: filler only or the complete path from bottle supply through labeling and packing.
Time basis: scheduled shift time, net planned production time, or running time only.
Output basis: total containers, accepted bottles, packed cases, or pallet-ready units.
A rating validated on a 500 ml PET bottle should not be applied automatically to a 1.5 L bottle, a glass bottle, or a large container. Ask for a speed statement for each commercial SKU that matters to the project.
Three Formulas for Real Capacity Planning
Calculate actual good-bottle BPH from production data
Actual good-bottle BPH = Sellable bottles produced / elapsed production-window hours
If a line produces 72,000 accepted bottles during an eight-hour production window, its actual good-bottle rate is 9,000 BPH. Keep normal short stops inside that window. Removing every stop produces a running rate, which is useful for diagnosis but can overstate what the plant can deliver per shift.
Estimate daily sellable output
Estimated good bottles/day = Rated BPH x net planned production hours x planning factor
The planning factor is a documented assumption that combines unplanned downtime, reduced-speed operation, and quality losses. It is not a universal industry percentage. Build it from the plant's records when available; for a new line, compare several scenarios and label them as assumptions.
Planning factor | 12,000 BPH x 10 hours | Interpretation |
100% | 120,000 bottles/day | Theoretical ceiling; no operating losses |
90% | 108,000 bottles/day | Illustrative high-performance scenario |
80% | 96,000 bottles/day | Illustrative base scenario |
70% | 84,000 bottles/day | Illustrative stressed scenario |
Size the rated line from a daily target
Required rated BPH = Daily sellable target / (net planned production hours x planning factor)
Suppose the target is 100,000 sellable bottles per day, the line has 10 net planned production hours, and the approved planning assumption is 82%. The calculation is 100,000 / (10 x 0.82) = 12,195 BPH. The buyer should therefore evaluate a line class that can exceed 12,195 BPH under the same bottle and scope conditions, rather than assuming a nominal 12,000 BPH line is sufficient.
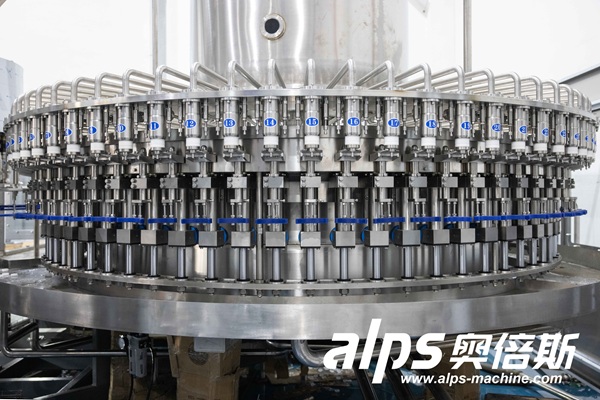
Use an OEE-Style Breakdown When One Factor Is Too Crude
ISO 22400-1 provides an industry-neutral framework for manufacturing KPIs, while
ISO 22400-2 presents KPI definitions, formulas, and characteristics. A practical OEE-style model separates three different loss mechanisms instead of hiding them inside one percentage:
Good output = Rated BPH x planned production time x availability x performance x quality
Factor | Working definition | Typical questions |
Availability | Running time / planned production time | How much time was lost to faults, waiting, or other stops? |
Performance | Actual run rate / reference rate while running | Did the line run below its validated speed? |
Quality | Accepted bottles / total bottles produced | How many bottles were rejected or reworked? |
For example, an 18,000 BPH line with 14.5 planned production hours, 90% availability, 96% performance, and 99.5% quality would yield about 224,376 good bottles. These percentages are illustrative, not benchmarks. The time basis must be agreed first, or planned cleaning and changeovers may be subtracted once from the schedule and then counted again as availability loss.
Consistent machine-state data makes this calculation more defensible. The
OMAC PackML framework supports common machine states and consistent performance data across equipment from different controls suppliers.
Why Rated BPH Falls Short at the End of the Line
Line constraints and buffering. The sustainable line rate depends on how the blower, rinser-filler-capper, labeler, packer, and conveyors interact. Detailed
water filling line speed matching belongs in the dedicated line-balancing guide.
Micro-stops. Brief cap-feed, label, sensor, or conveyor interruptions can reduce shift output without appearing as a major breakdown. A
Sidel bottling-line example shows how repeated labeller stops can erode OEE and why line events need to be measured, not guessed.
Bottle-format changes, inconsistent containers, insufficient treated-water supply, utilities, inspection rejects, and packing-material replenishment can also reduce output. These factors matter here only as capacity losses; their equipment specifications and acceptance tests belong to the later cluster articles.
Convert BPH to Liters and Plan Mixed-SKU Production
Liters per hour = BPH x bottle volume in liters
At 12,000 BPH, 500 ml bottles represent 6,000 L/h. At 8,000 BPH, 1.5 L bottles represent 12,000 L/h. This conversion helps compare water-treatment demand and sales volume, but it does not prove that one machine can run both formats at those speeds.
Required production hours = Sum of (SKU target / validated BPH for that SKU) + changeover and sanitation time
For a mixed portfolio, calculate time separately for each bottle size using its validated rate. Then add planned changeovers, sanitation, and start-up time. A single average BPH can conceal a slow large-format SKU that consumes most of the available shift.
Capacity Checklist Before Requesting a Quote
Daily sellable-bottle target for normal and peak periods.
Shift pattern, net planned production hours, and maintenance window.
Bottle drawings or samples for every important SKU, plus cap details.
Required line boundary: filler only, packed cases, or pallet-ready output.
Label type, pack format, case count, and expected changeover frequency.
Rated speed and validated speed curve for each bottle format.
The agreed definition of accepted output, downtime, speed loss, and rejects.
Future demand scenario, while keeping current and speculative demand separate.
A Practical Capacity Decision Rule
Choose the smallest technically suitable line class that meets the required peak output under documented bottle, time, and efficiency assumptions while preserving planned sanitation and maintenance time. Compare at least a base, high-demand, and stressed-output scenario. Then ask suppliers to state the guaranteed test boundary and conditions in the proposal rather than relying on an unlabeled BPH figure.
For a project-specific calculation, prepare the daily target, bottle sizes, shift schedule, label and pack formats, and the required output point. That information allows the line configuration to be sized around sellable production rather than nominal filler speed.
Frequently Asked Questions
Does a 12,000 BPH filler guarantee 12,000 finished bottles per hour?
No. The rating describes output under stated conditions. Finished-bottle throughput also depends on bottle supply, capping, labeling, packing, conveying, stops, reduced-speed operation, and rejects. Ask whether the figure is measured at the filler or at the agreed end-of-line point.
Should cleaning and changeover time be included in daily output?
Yes, but count it consistently. One method subtracts planned cleaning and changeovers to obtain net planned production time, then applies an efficiency factor only to that time. Do not subtract the same planned loss again inside availability or the general planning factor.
How much spare capacity should a buyer add?
There is no universal margin. Model normal demand, peak demand, product-mix changes, maintenance access, and realistic operating losses. Excess capacity increases capital and utility requirements, while too little capacity creates overtime and missed orders. The margin should be traceable to a demand scenario.
Can BPH be compared across 500 ml and 1.5 L bottles?
Only when the supplier provides validated speeds for both formats under comparable conditions. Larger bottles may change filling time, handling stability, conveyor spacing, and downstream pack cycles. Compare both BPH and liters per hour, then calculate the production time required for each SKU.
What data should be captured after the line starts production?
Capture scheduled time, running time, good and rejected bottle counts, actual speed, fault duration, starved and blocked states, changeovers, sanitation, and the equipment causing each stop. These records turn the next capacity review from an assumption exercise into an evidence-based calculation.
Conclusion
Real water filling line capacity is the sellable output achieved within an agreed operating window, not the fastest number printed in a quotation. Define the bottle and line boundary, calculate the required BPH from daily demand, test several loss scenarios, and keep planned time separate from operating losses. This produces a capacity decision that purchasing, engineering, production, and sales teams can all evaluate on the same basis.